Concentrated bets

When I’ve looked at all the investors (that) have very large reputations — Warren Buffett, Carl Icahn, George Soros — they all only have one thing in common. And it’s the exact opposite of what they teach in a business school. It is to make large concentrated bets where they have a lot of conviction.

We believe in making high-conviction bets where our process demonstrates asymmetrically higher reward per unit of risk taken
Top holdings (SEP-25)
Top # stock Holding value
Top holding 12.1
Top 3 holdings 36.0
Top 5 holdings 55.5

Unlike the popularly accepted notion that diversification drives risk, our belief is that the quality of portfolio companies drives risk rather than the quantity of companies in a portfolio.


In fact, our view is that building concentrated portfolios reduces risk as the fund manager’s focus is on relatively lesser positions and hence can react better relative to other market participants when the story changes.
For details on our framework for selecting companies, please click here

What we do

  • Bottom-up stock picking
  • High conviction bets
  • Investments in focused sectors

What we don’t

  • Benchmark hugging
  • Under-weight/overweight
  • Broad-brush representation across sectors
Concentrated portfolios ≠ higher volatility

Since inception, our portfolio’s volatility (having <15 companies) is not significantly different from our benchmark that has 500+ companies as shown below
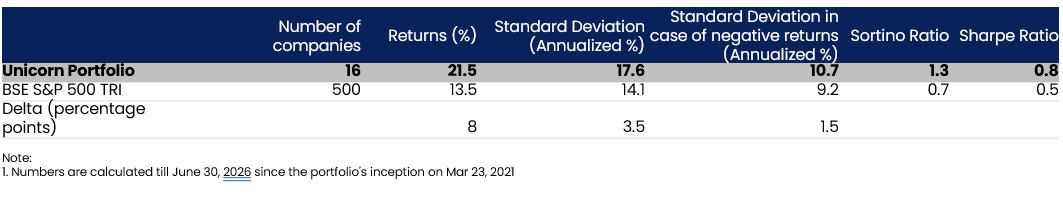
The table presents a performance comparison between the Unicorn Portfolio and the BSE S&P 500 TRI benchmark index from the portfolio's inception on March 23, 2021, through September 30, 2025. Since its inception in March 2021, the **Unicorn Portfolio** has significantly outperformed the **BSE S&P 500 TRI**, delivering an annualized return of **28.7%** versus **15.6%** for the benchmark—a difference of **13.1 percentage points**. Although the portfolio experienced slightly higher volatility (**17.4%** vs. **13.9%**), its superior **Sharpe Ratio (1.1 vs. 0.6)** and **Sortino Ratio (1.7 vs. 0.9)** indicate substantially better risk-adjusted returns. Overall, the portfolio generated stronger performance while maintaining a reasonable level of risk.
Image Description:   Portfolio Performance Comparison: Unicorn Portfolio vs. BSE S&P 500 TRI The table presents a performance comparison between the Unicorn Portfolio and the BSE S&P 500 TRI benchmark index from the portfolio’s inception on March 23, 2021, through September 30, 2025. Key highlights include: The Unicorn Portfolio, consisting of 13 companies, delivered an impressive annualized return of 28.7%, significantly outperforming the BSE S&P 500 TRI, which generated 15.6% returns from a diversified basket of 500 companies. This translates to an outperformance (alpha) of 13.1 percentage points over the benchmark. The portfolio exhibited a slightly higher annualized volatility (standard deviation) of 17.4% compared to 13.9% for the benchmark, indicating a moderate increase in overall risk. On the downside-risk measure, the Unicorn Portfolio recorded a negative-return standard deviation of 10.8%, versus 9.2% for the benchmark, suggesting that downside fluctuations remained relatively controlled despite higher returns. Risk-adjusted performance metrics strongly favor the Unicorn Portfolio: Sortino Ratio: 1.7 vs. 0.9 Sharpe Ratio: 1.1 vs. 0.6

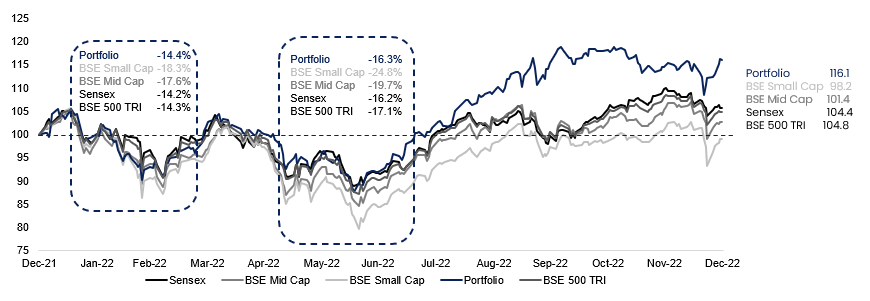
In a volatile CY2022, our drawdowns were lesser than headline indices while bounce-backs were stronger

Scroll to Top