Summary
While our unwavering focus is on bottom-up fundamental investing, in this newsletter we take a top-down view and discuss a unique characteristic of ‘small-caps’. Given their relatively lower size, low liquidity, lack of institutional ownership and higher information asymmetry, the small-cap universe periodically experiences ‘Breakouts’, which are accompanied by rapid acceleration of stock prices in a brief period of time. In our current study of the last ten years, these breakouts were associated with a median 4.6X increase in stock
prices over a short period of 1.4 years.
However, not all breakouts are the same, in fact a few result in substantial capital losses if not understood well. In this newsletter, we analyze the characteristics of these breakouts, discuss how structural breakouts are different from cyclical and one-time blips, and show how investing in structurally strong companies at the time of their breakouts can result in disproportionate wealth generation.
We hope you enjoy reading this newsletter!
Nine-month portfolio performance update
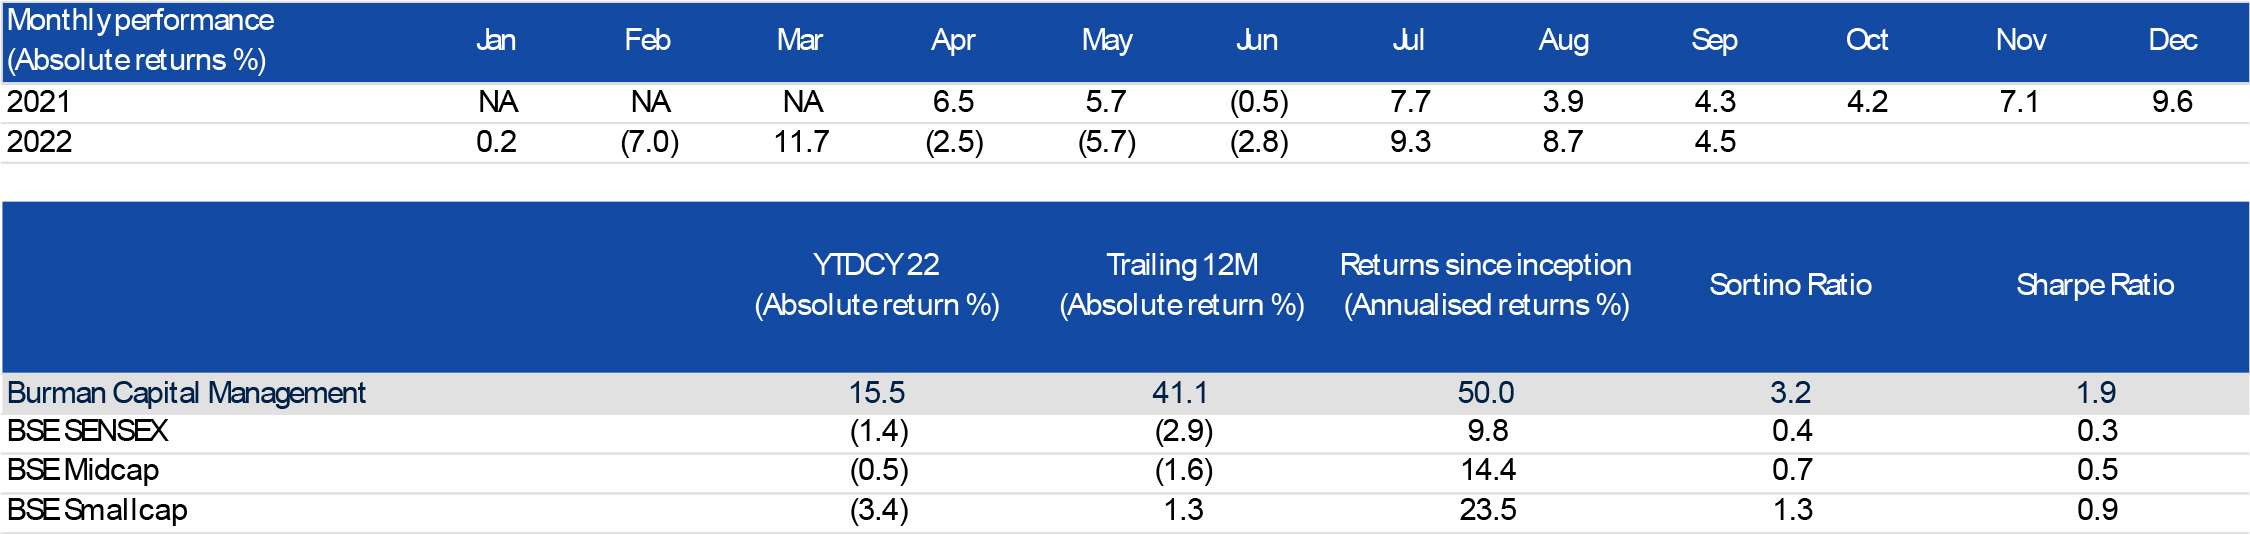
We continue to outperform our key benchmarks by significant margins. Since inception, our portfolio has outperformed the BSE Smallcap, BSE Midcap, and BSE Sensex by more than 2,600, 3,500 and 4,000 bps respectively on an annualized basis.
In the last 12months while returns for BSE Smallcap, BSE Midcap and BSE Sensex are flat to negative, i.e. 1.3%, -1.6% and -2.9% respectively, we are up 41.1%.
In CY2022 as well, while all benchmark indices are down i.e. BSE Smallcap, BSE Midcap and BSE Sensex are down -3.4%, -0.5% and -1.4% respectively, our portfolio is up 15.5% delivering outperformance of between 1,600 bps to 1,800 bps over various indices over a nine-month period
Performance Snapshot
Notes:
• Portfolio inception date is Mar 23, 2021
• Sharpe and Sortino Ratios are since inception
What is a ‘Breakout’?
We define a breakout as the period of fastest growth over a decade in a company’s stock price before a 20% correction. In our current study, we looked at the last ten-year period i.e. starting Oct, 2012 and focused on stocks ranked between 251 and 1,000 by market capitalization. From this list we excluded companies that are not traded as of Sep 30, 2022.
We added a further filter of at least Rs10 bn of market capitalization at the time of the break-out to eliminate the most illiquid names. This resulted in 120 stocks for evaluation. Key characteristics of these companies are described in the following sections
Small-cap ‘Breakouts’ drive 4.6X growth in a short period of 511 days/1.4 years
At the median-level, the companies identified above deliver 4.6X returns over a period of 511 days from the time a breakout begins. The median market cap at the time of the breakout is Rs16.5 bn. Interestingly this period is associated with close to 83% of overall returns for these companies over a 10-yr period!

Logically, these breakouts are associated with substantial improvement in fundamentals for e.g. two-year pre-breakout revenue growth for the companies under consideration increased from 7.8% to 14.2% two-year post; EBITDA and PAT growth is much sharper at 7.7% to 23.5% and 9.8% to 26.0% respectively.

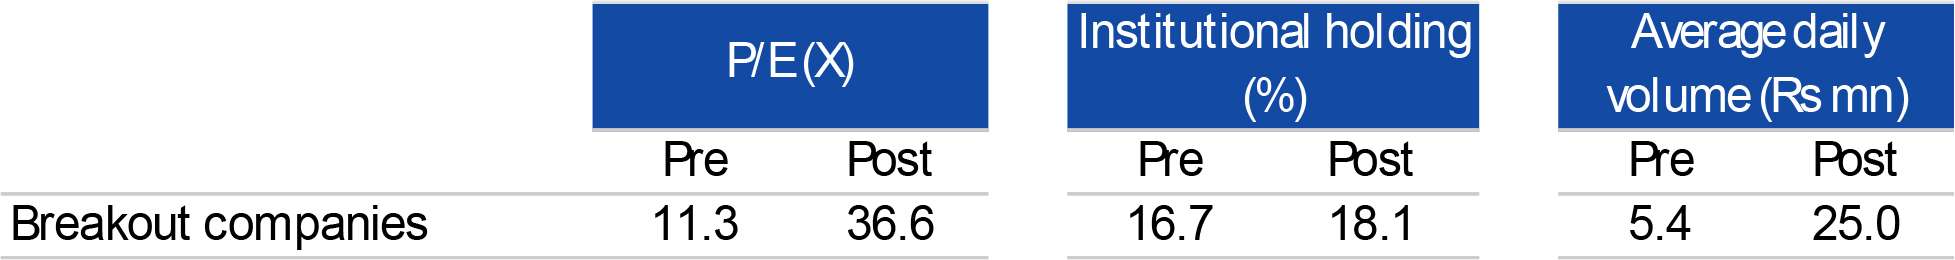
In addition to improving fundamentals, breakouts were also associated with sharp re-rating wherein the TTM P/E multiple increased from 11.3X to 36.6X. This period is also associated with increase in institutional shareholding from 16.7% to 18.1% and a sharp rise in average daily volumes from a median of Rs5.4 mn to Rs25.0 mn.
Not all Breakouts are the same
We classified the 120 companies into three categories basis their 10-year stock performance – (1.) Structural breakouts, (2.) Cyclical breakouts and (3.) One-time blips.
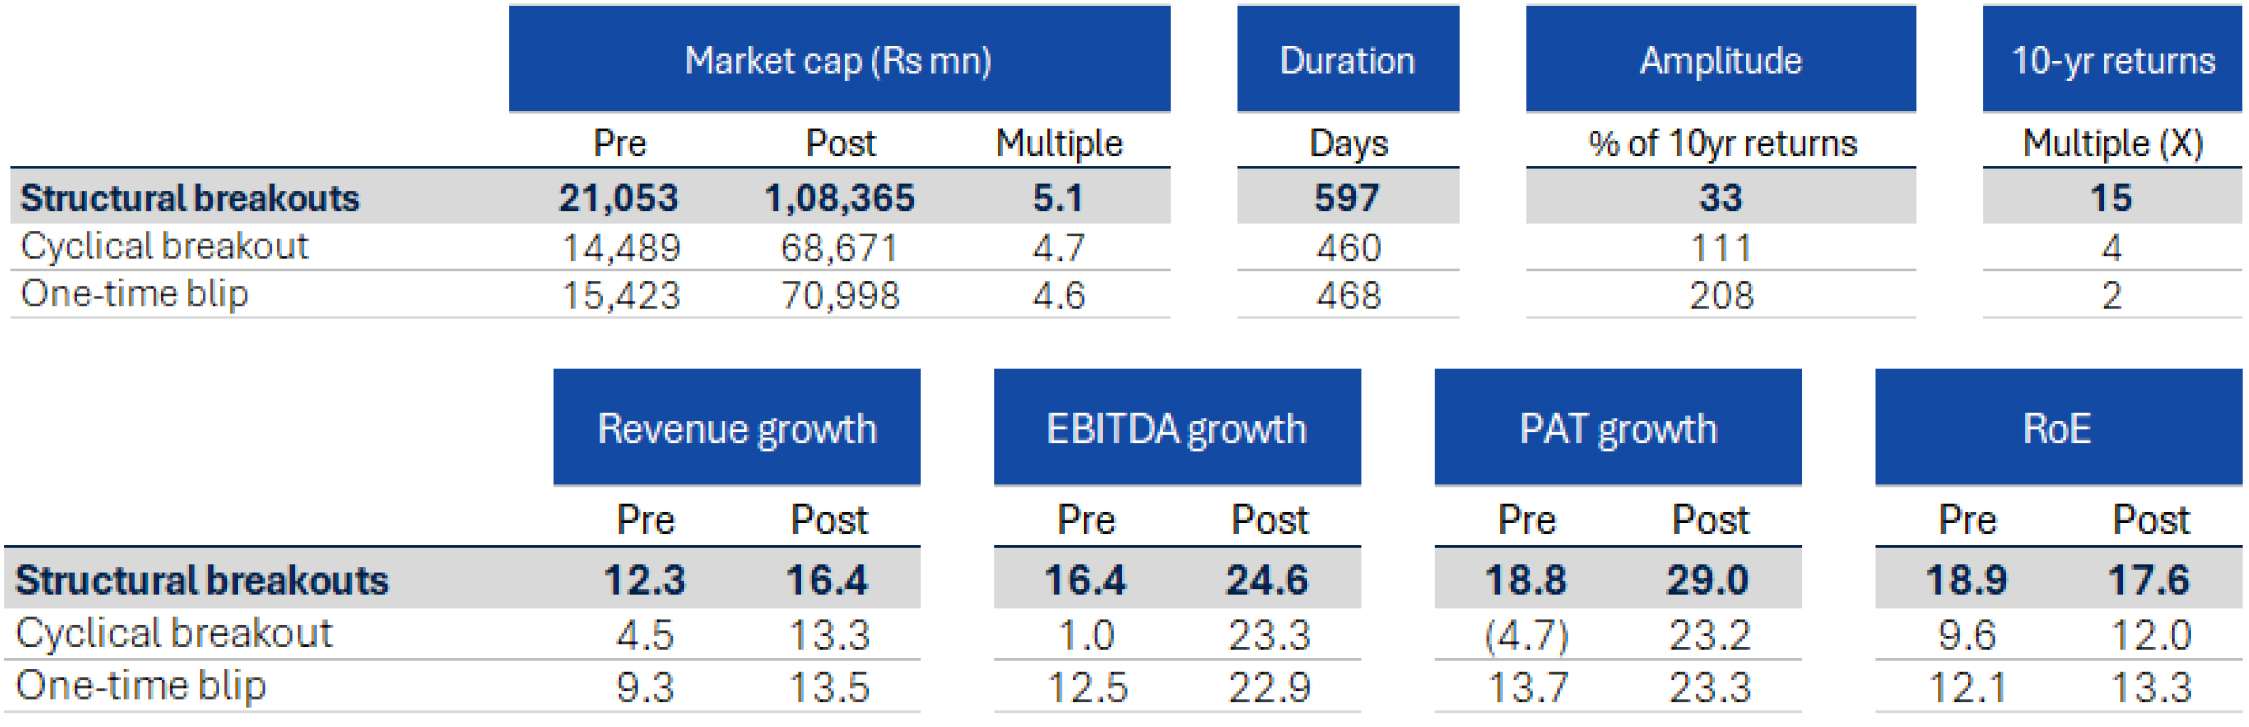
The key characteristic of companies in each of these categories is shown in the table below. A few areas that standout
• Revenue/profit growth rate of cyclical breakouts during the breakout period far exceed those of
structural breakouts i.e. growth rates were lumpier and more disproportionate vs. preceding periods
• Amplitude of breakout as % of 10-year return is far higher for cyclical/one-time blip vs structural. For
structural breakouts, this period only drives 33% of 10-yr returns vs 111-208% for others
• 10-yr returns of companies in the structural category is 15X vs 4X and 2X for cyclical/one-time blips.
While returns generated by structural breakouts during the breakout period were similar to
cyclical/one-time blips, returns over a 10-yr period were far in excess
• Time period of breakout of cyclical/one-time is shorter than structural
• Structural companies had much higher RoEs at the start of the period 18.9% vs cyclical/one-time blips
at 9.6%/12.1%
• From the middle of the breakout period, median IRR for structural companies was 32.9% vs 25.3%
and 2.7% for cyclical and one-time blips respectively till Sep-22
How to differentiate between structural ad cyclicals/one-time blips
Figures above show how disproportionate returns are generated if one can identify structural plays at the time of breakouts. In our assessment, there are several important parameters that can help differentiate between structural vs other breakouts
• Better quality growth associated with sustainable growth drivers
• Structural businesses typically have a strong competitive advantage, evidence of which can be found
by analyzing pricing power, market share trends, among others
• Strong management teams
• Good quality of business as evidenced by high RoE
• Fundamental nature of the industry should not be prone to periodic cycles
While the above may sound intuitive in hindsight, the key challenge is to differentiate between the different types of businesses looking forward. Several businesses (especially untested) might look like structural stories during a breakout but might be cyclical or even worse one-time blips.
Having a robust process of filtering-out such businesses coupled with strong on-ground diligence are key to avoid falling prey to such mistakes.
How to identify potential Breakouts and when to invest
Basis our study we have seen several common drivers behind breakouts, please note that these drivers are seen associated with breakouts but are far from being necessary or sufficient
• Global tailwinds, for e.g. China + 1 in specialty chemicals
• Regulatory tailwinds for e.g. PLI scheme in electronics manufacturing
• Management transition/renewed focus
• Competitive tailwinds such as exit or scale-down by key competitor
• Corporate actions such as divestments
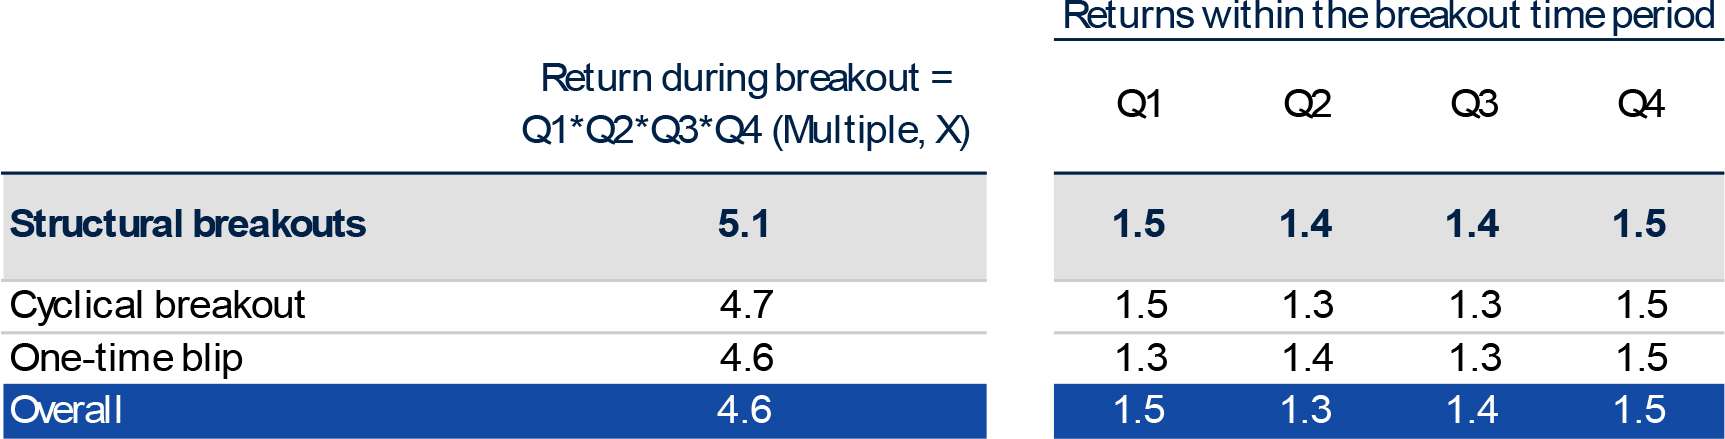
If one identifies a structural breakout, there is no dire need to time the inflection point. The table below shows how evenly distributed the returns are across four quartiles of the breakout period. To help read the table below, for structural breakouts, the median returns is 5.1X during the breakout period, in the first 25% days of the breakout period the return was 1.5X, for the second 25% days it was 1.4X and so on.
While returns are evenly distributed, the IRRs post breakout differ substantially depending on whether the company is a structural play or cyclical/one-time blip as shown below
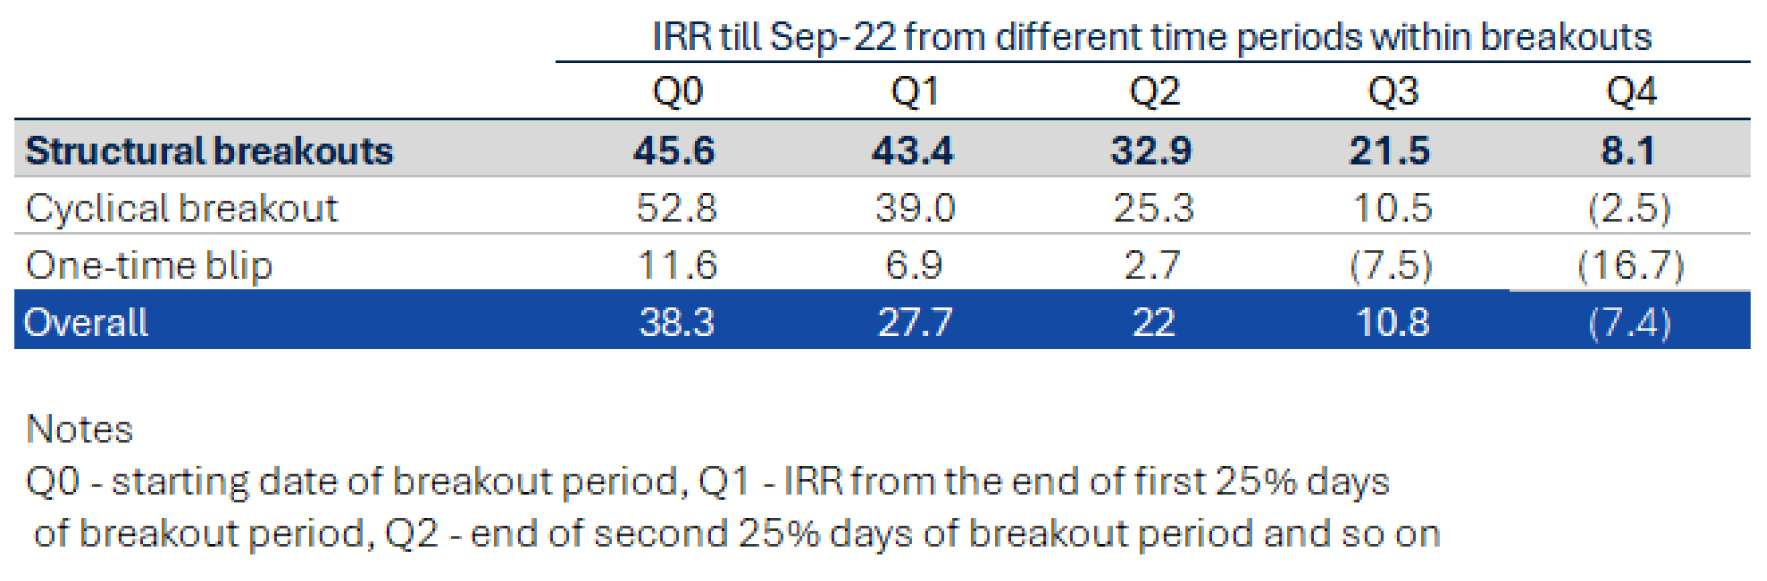
From the table above its clear that its more important to identify the right opportunities than rushing to invest. For instance, in structural breakouts, even if one invests after Q2 i.e. 2-3 quarters post breakout starts, median IRRs are 32.9%.
On the flipside, if one erroneously invests in cyclicals/one-time blips late in the breakout period say, Q3 or Q4, there is a possibility of substantial wealth destruction.