Summary
IMF expects India’s real GDP to grow at 6.5% over the period 2020-28E making it the fastest growing major economy in the world. By 2027E, it projects India to become the third largest economy globally overtaking Japan and Germany. Recently, there has been a deluge of global opinions stating that the current decade belongs to India, McKinsey’s CEO Bob Sternfels in fact said it is not just India’s decade but India’s century!
We do not have the ability to predict the current decade let alone a century, but we are firm believers of the India story because of its demographic dividend, massive physical and digital infrastructure creation, regulatory push, among others. We also believe that many Indian entrepreneurs will harness these tailwinds and generate disproportionate value for shareholders over the long-term.
However, in the newsletter we take a critical view on certain narratives around the India opportunity and try to size them up vis-à-vis ground realities. The idea is not to poke holes in the India story but to promote critical thinking around the subject. Leading, hopefully, to better investment decisions.
Portfolio performance update
After a strong Jun-23 quarter, headline Indian indices S&P BSE SENSEX and NSE Nifty 50 delivered a flattish quarter in the Sep-23 quarter. However, the bull market in the broader market continued. While part of this can be attributed to a strong earnings season, there seems to be euphoria in certain pockets.
Our portfolio reported returns of 9.4% vs. 5.5% for our benchmark S&P BSE 500. Since inception i.e. Mar 23, 2021, our portfolio has delivered annualized returns of 42.6% vs. S&P BSE 500 returns of 15.7%, delivering outperformance of close to 2,700 bps. Over the last twelve months, our portfolio has delivered 31.9% returns vs. 17.5% for the benchmark.
Performance Snapshot
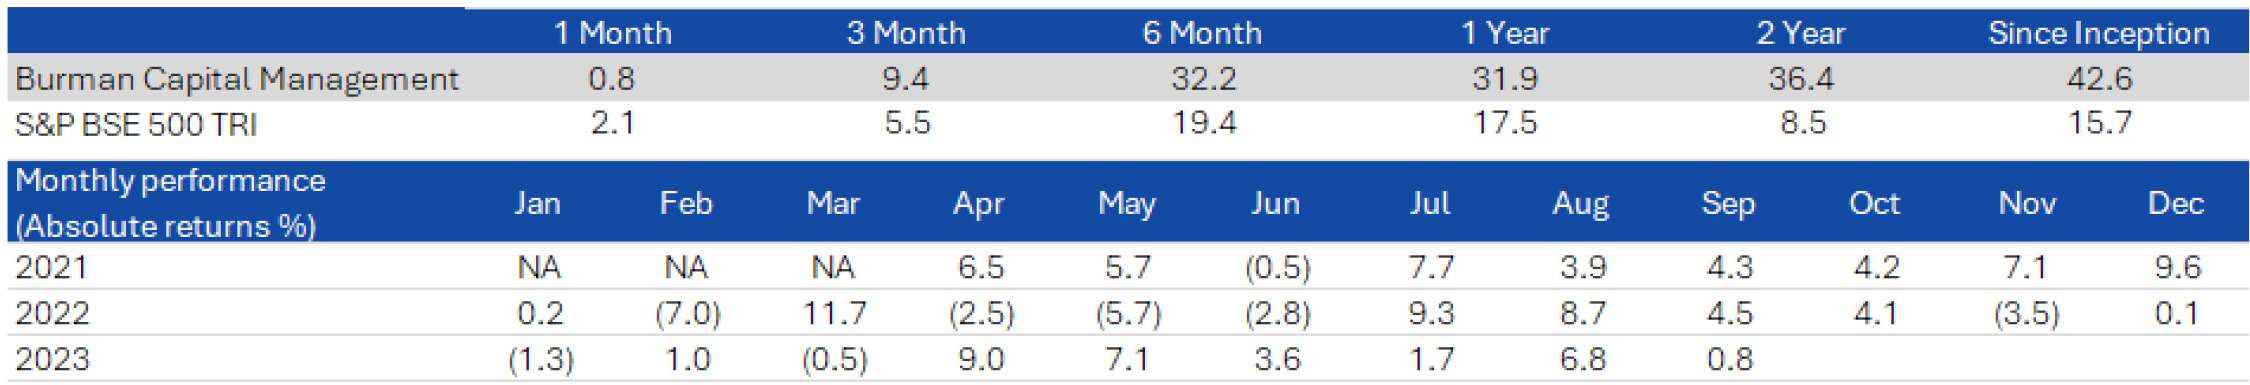
Note: All returns are net of fees and expenses (TWRR). Since inception and two year returns are annualized; other time period returns are absolute. Benchmark changed effective from 1st April, 2023 to S&P BSE 500 TRI from S&P BSE Small Cap Index, according to SEBI circular dated December 16, 2022.
The India story
Investment pitches on India tend to focus on some or all the following five long-term trends viz. Consumption, Manufacturing, Digitization, Financialization and Energy. We, too, are believers in these trends and think that over the long-term their impact on the Indian economy will be enormous. However, we are slightly critical of – (1.) the reasoning behind promoting some of these trends, (2.) pace of realization of these trends and (3.) relevance or applicability of some of these trends. To showcase our thought process, we discuss two of the
above trends viz. Consumption and Manufacturing below.
Consumption
India is the most populous country in the world with a population exceeding 1.4 bn across 300 mn+ households. A comprehensive report published by Google, Temasek and Bain titled ‘The economy of a billion connected Indians” estimates that high, upper, and middle class households that form about 117 mn households in 2022 will likely increase to 200 mn by 2030E. India’s per capita GDP over the same period is predicted to more than double to US$5,500 from US$2,500. Other reports around the subject, predict similar numbers and the conclusion in most is that this increase will drive a consumption boom like the boom seen in China, South Korea, and other large Asian economies in the past. As a result, consumer discretionary categories such as ACs, washing machines, cars, refrigerators, among others will likely hit a J-curve as these are highly under-penetrated categories in India when compared to global benchmarks.
While the argument on the face of it looks compelling, it starts weakening when one starts getting deeper. One of the underlying assumption of the argument is that income distribution will be proportionate i.e. the benefits of GDP increase will flow through the population increasing spending power democratically. This sadly hasn’t happened in the past, for instance over the period 2018-23 the number of tax filings by people earning greater than Rs1 cr (US$120,000) has increased by 73% while the total tax filings have increased just by 10%. Filings in the lowest income bracket are up a meagre 2%. According to Oxfam, 5% Indians control 60% of the country’s wealth. The Indian income pyramid is not getting broader but is getting fatter at the top. If one does an analysis from a geographical distribution of wealth standpoint, results are similar. The most populous states, U.P. and Bihar have the lowest GDP per capita, both under US$1,000, and are also
amongst the slowest growing states over the last twenty years; rich states are getting richer.
In addition to wealth distribution, there are specific infrastructure issues that plague certain consumption categories. Washing machines for example, require electricity and running water to function. It’s only in the last decade that electricity has been made available to households, but consistent availability of electricity and last-mile connectivity of households is still a problem. On water, as recently as 2019, there were only 16.8% rural Indian households that had a tap water connection, even today the number stands at around 60% despite strong government’s initiatives.
Another aspect to consider is cultural constraints. Households with non-working women tend to use washing machines lesser than households with working women. Hence, women labor force participation also becomes an important constraint. Therefore, it will be incorrect to expect a consumption J-curve unless the above constraints are resolved, which in our understanding will be gradual and not sudden.
Manufacturing
China’s global position has weakened considerably in the last five years driven by back-to-back events including the US-China trade war, COVID-19, Xi Jinping’s aggressive policies, among others. As a result, corporate boards across the globe are thinking of reducing/have reduced their China dependency. The common narrative is India with a large working population coupled strong policy action (PLI incentives, tax rate cuts, GST, among others) is well-placed to ace the opportunity. Adding credence to this are announcements by firms such as Apple that plans to have more than 25% of iPhone production from India by 2025. But does this mean that China + 1 has/will work across industries? Let’s look at the Active Pharmaceutical Ingredients (API) and API intermediates industries as an example.
Over the period 2016-18 two major developments centered around China i.e. China’s environmental crackdown of polluting industries and the US-China trade war were expected to significantly impact China’s standing in the global API supply-chain. Close to 150 API manufacturers shut down their facilities during the environmental crackdown. India has been dependent on imports for 70-80% of its API and API intermediates requirement for many decades. The stage was set for an upsurge of the Indian API industry especially given a large local pharma industry that they could supply easily to.
Interestingly since 2018, India’s API dependency on China has actually gone up. China currently accounts for ~75% of India’s total bulk drug imports by volume, up from 62% in FY2018. Even across the broader pharmaceuticals industry, China has solidified its standing. China’s total exports of pharmaceutical products stood at $14bn in 2022, up 52% from $9bn in 2019. During the same period, India’s pharma exports have increased by only 21%.
Our conversations with several Indian and Chinese manufacturers reveal that cost is still the key buying criterion for generic
PI/intermediates customers. Due to China’s significant historical investments in building large-scale capacities, it is offering significantly lower and stable prices vs Indian manufacturers
To provide support to the Indian API industry, the government committed to three mega Bulk Drug parks and launched the Bulk Drugs PLI in July 2020 with an incentive size of US$0.8 bn. ~40 companies have applied for an investment of $0.6 bn under the scheme. With time, this initiative might help the Indian API industry gain a strong footing, but we will not blindly bet on it.
Hopefully, the above arguments will showcase how expecting J-curves based on macro-level narratives without understanding ground-level realities may lead to uninformed conclusions. The only way to differentiate between narratives and reality is by mapping out entire ecosystems and understanding ground realities by interacting with multiple stakeholders, looking at statistics holistically rather than in an isolated manner, identifying blind spots, developing a critical thinking outlook, and most importantly, not blindly following the herd.
Our approach to investing is bottom-up with a focus on doing deep fundamental research on companies and industries so that we can assess the long-term sustainability of businesses we invest in. Our process enables us to have an unbiased opinion as shown in the examples above.