Summary
In our previous newsletter, “The relentless small-cap rally”, we had discussed how India’s slowing economy poses a significant risk to stocks especially small-caps (read section: “How small-cap rallies have ended in the past” in the above newsletter). Over the last four months since we published the newsletter, markets in general and small-caps in particular have corrected sharply with peak drawdown up to 20% at index levels.
Individual stock correction has been deeper, with median correction of the top 1,250 companies in India by market capitalization at 32%. This correction has largely been driven by a slew of intrinsic and extrinsic factors. Intrinsic factors include (1.) cyclical slowdown in India’s GDP, (2.) poor earnings delivery by corporates and (3.) elevated valuations. The most material extrinsic factor has been incessant selling by foreing investors since Donald Trump was voted in as the President of the United States.
The correction has been democratic i.e. companies that have been performing well have also seen sharp drawdowns. As a result, valuations have become attractive in certain pockets. Our stance has changed from one of caution to calibrated deployment. The key risk is a prolonged slow down in the economy hurting consumer and business sentiment.
Portfolio performance update
During the Sep-Dec 2024 quarter our portfolio delivered returns of 6.4% vs -7.8% for our benchmark S&P BSE 500 TRI.
Since inception i.e., Mar 23, 2021, our portfolio has delivered annualized returns of 38.3% vs. S&P BSE 500 TRI returns of 18.2%, delivering outperformance of 2,000 bps annualized.
Over the last three years, our returns have been 28.4% vs 15.4% for our benchmark, an outperformance of close to 1,300 bps annualized. Over the last two years, annualized returns have been 35.1% vs 21.0% for our benchmark.
Performance Snapshot
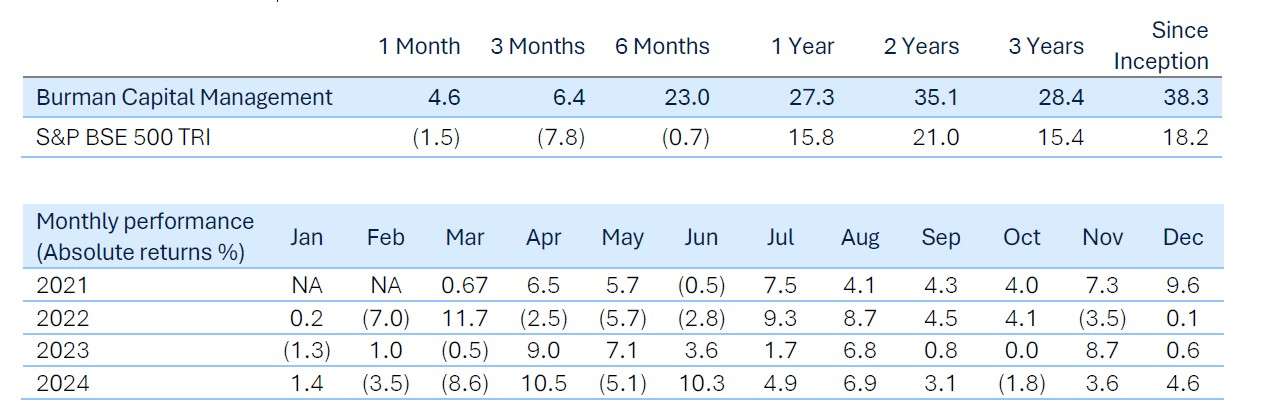
Note: All returns are net of fees and expenses (TWRR). Since inception, two-year and three-year returns are annualized; other time period returns are absolute. Benchmark changed effective from 1st April 2023 to S&P BSE 500 TRI from S&P BSE Small Cap Index, according to SEBI circular dated December 16, 2022.
Correction across the board
Headline indices corrected sharply
As of the previous close from the date of this newsletter i.e., Jan 28, 2025, all major headline indices have corrected sharply since Sep 30th, 2024 with BSE Sensex, BSE MidCap and BSE SmallCap correcting by – 10.6%, -16.3% and -16.9% respectively; timing of the correction has varied for different indices as shown in the chart below. The BSE SmallCap index hit an intra-day peak drawdown of 20% on Jan 28, 2025. Our portfolio over the same period corrected by 8.2%.
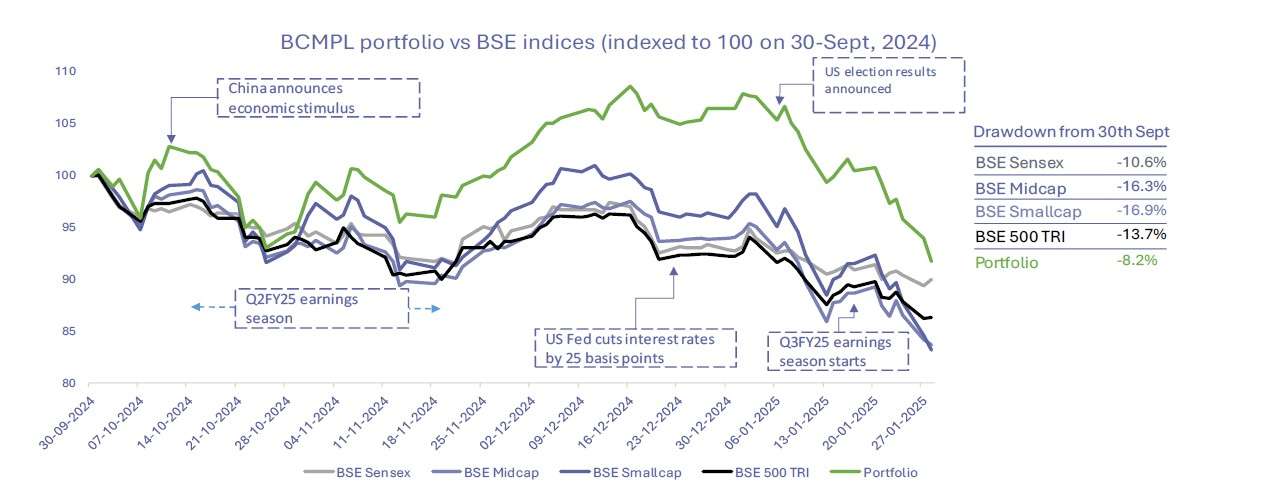
20% corrections are not uncommon for the BSE SmallCap index, in fact in the last twenty years there have been ten such instances with one occurring every 2-3 years. The last two being (1.) in 2022 post the Russia-Ukraine war and US FED’s rate hike cycle and (2.) in 2020, when COVID-19 struck. Interestingly four of theten 20% corrections turned into more painful bear markets, including during the great financial crisis in 2008 and the COVID-19 pandemic in 2020.
Stock-level correction is deeper
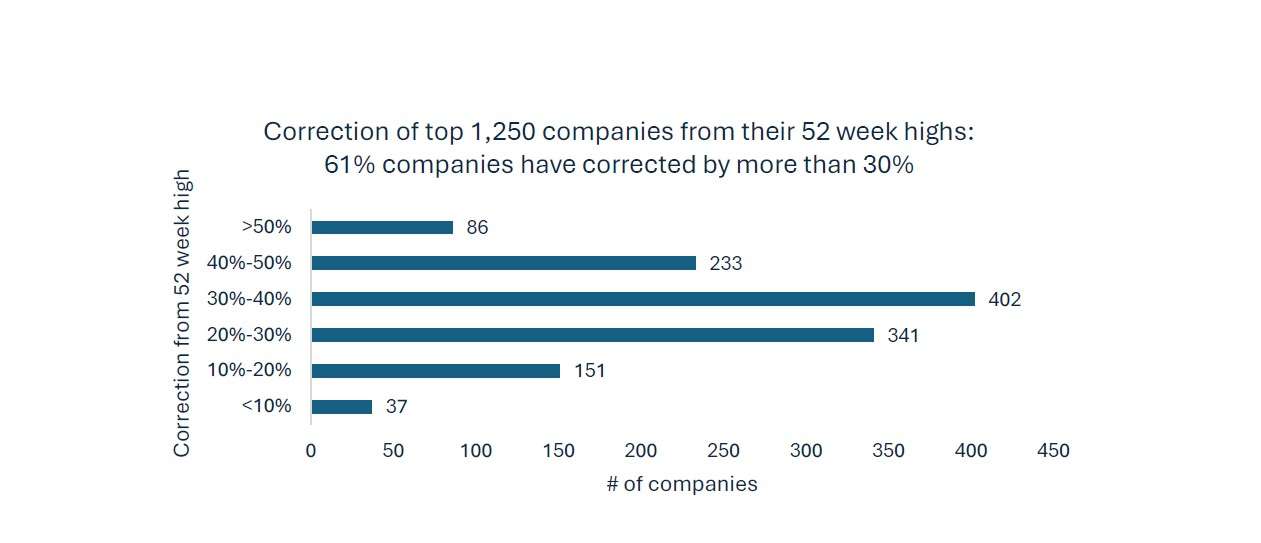
Median stock correction from peak has been 32% for the top 1,250 companies by market capitalization.
The table below shows correction in companies at different levels.
From the table, the intensity of the correction is clear. 86 companies have corrected more than 50%, 319 companies have corrected more than 40% while only 37 companies have corrected less than 10%.
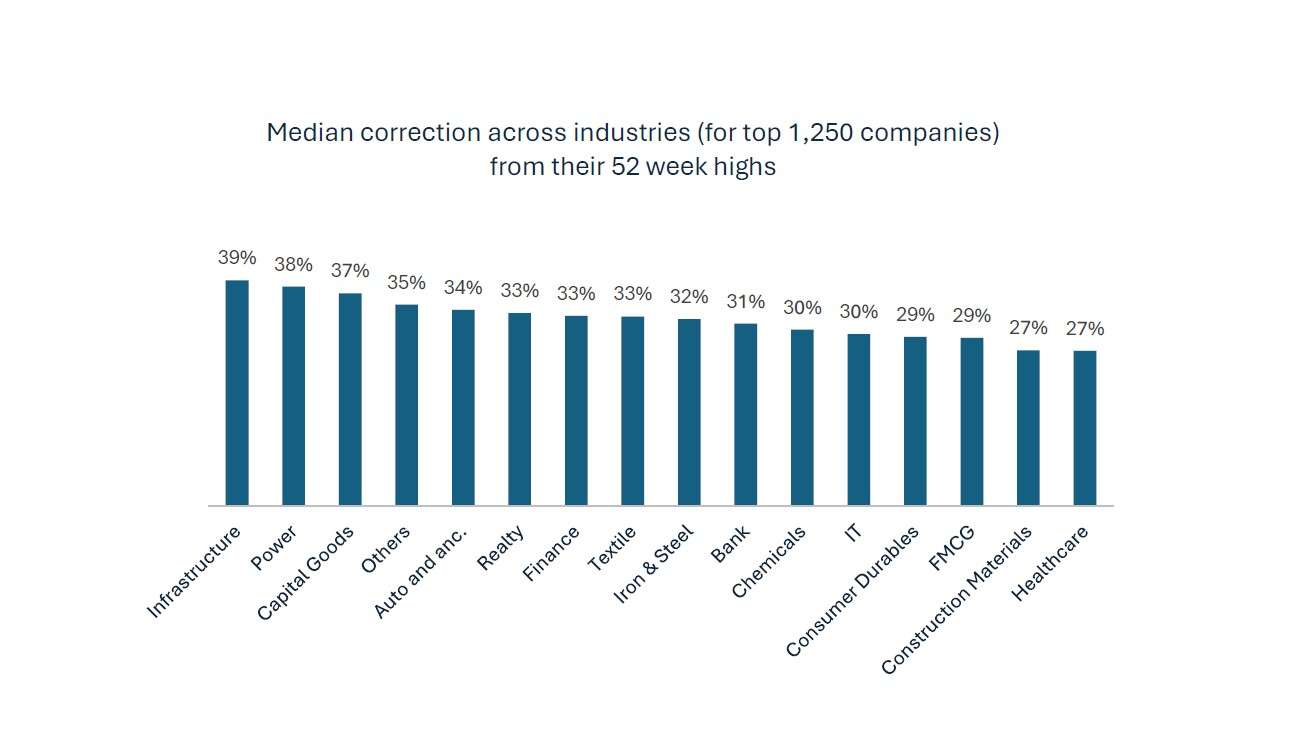
The correction has also been broad-based across industries. Although high beta industries such as
Infrastructure (-38%) and Capital goods (-37%) have seen sharper corrections while more defensive
industries such as FMCG (-29%) and Healthcare (-27%) have corrected less.
Approach going forward
After six months of being cautious, we feel more comfortable at current price levels. While valuations are still elevated, generally speaking, several pockets of value have emerged. Our focus, as always, is on identifying companies run by exceptional management targeting industries that have a large addressable market at a time when they are undiscovered. We believe the disproportionate correction across the board provides opportunity to invest in strong companies which have been beaten down for no idiosyncratic reasons.
If you would like to discuss our approach in the current market in more detail, please feel free to write to me at agupta@burmancapital.com.
About Burman Capital Management
Burman Capital Management is a part of Burman Family Holdings, the strategic investment platform of the Burman Family, which over the last twenty years has invested over US $500 million in various businesses primarily in India and have partnered and joint ventured with many of the leading Fortune 100 companies from around the world. The Burman family are the control shareholders of the Dabur Group. Dabur was founded in 1884 by Dr. S.K. Burman and is today one of the largest Indian Fast Moving Consumer Good Company in India with over US$1 billion in revenue and a market capitalization of over US$10 billion.
At Burman Capital Management, we are long-term investors with deep passion for identifying and investing in exceptional businesses early. We are fundamentals-driven bottom-up investors and run concentrated portfolios focusing on small to mid-size companies. We are a SEBI-registered Portfolio Manager with registration number INP100007091.
Disclaimer
The information contained herein is strictly confidential and meant solely for the use of authorized recipient only. If you have received this report by mistake or are not the intended recipient, please notify the company immediately and destroy this report. The information contained in this report does not construe to be any investment, legal or taxation advice to the recipient. It is only for private circulation and use. While care has been taken by the Company to ensure completeness of the information in this report, as the report is system generated it has not been independently verified and no guarantee expressed or implied is made as to its accuracy. The company shall not be liable for accuracy of the information contained herein with respect to the recipient of this report and disclaim any and all liability as to the information set forth herein or omissions here from, including, without limitation, any express or implied representation or warranty with respect to such information. Performance related information provided in this report and investment approach provided hereunder has not been verified by SEBI or any other regulatory authority. No action shall be solicited on the basis of the contents of the information provided. Please note that past performance of the financial products, instruments and the portfolio does not necessarily indicate the future prospects and performance thereof. Such past performance may or may not be sustained in future. Company investment decisions may not be always profitable, as actual market movements may be at variance with anticipated trends. Investments in securities are subject to market risks and other risks and there is no assurance or guarantee that the objectives of the company will be achieved. Please read the Disclosure Document carefully before investing. Performance relative to other Portfolio Managers within the selected Strategy: Click here. Neither company nor any of its affiliates, associates, representatives, directors, or employees shall be responsible for any loss or damage that may arise to any person due to any action taken on the basis of this report. Risk factors associated with the investment approach have been provided under the Disclosure Document that can be referred to at www.burmancapital.com.