Summary
Given an option of investing in one of two stocks below – which one would you choose?
• Stock A has operating margins of 13.5%, high leverage with net debt to EBITDA ratio of 4.3X, weak ROIC1 of 3% and negative earnings; P/E2 on all-time peak reported profits of 18X
• Stock B has strong operating margins of 25.0%, is net cash (debt lower than cash holdings), strong ROIC of 32% and trades at P/E ratio of 18X (trailing)
• Assume that for both Stock A and Stock B, the long-term fundamental prospects e.g. long-term growth prospects, quality of management, among others are similar
Most investors will likely be drawn towards Stock B given stronger fundamentals. Interestingly, Stock A returned 6.5X while Stock B is down 25% from the time the above numbers were reported.
A core tenet of our investment philosophy is what we term as ‘Specificity’. Each investment opportunity, each situation is unique – using benchmarks, shorthand, or analogies to reach conclusions leads to mistakes or missed opportunities. Approaching every situation using a first-principles approach i.e. knocking down the situation to core fundamentals and then reasoning up increases the probability of success in investing, in our view.
CY2022 portfolio performance update
CY2022 was a difficult year for equity investors globally with the headline indices of 19 out of the 20 largest countries by market capitalization delivering negative returns in USD terms. Headline Indian indices i.e. BSE SENSEX, BSE Midcap and BSE Smallcap delivered 4.4%, 1.4% and -1.8% local currency returns respectively during the year.
Despite the tough environment, our portfolio was up 16.1% (post fee) in CY2022 thereby delivering outperformance of 1,164, 1,470 and 1,788 bps over BSE Smallcap, BSE Midcap, and BSE Sensex. Since inception i.e. Mar 23, 2021, our portfolio has delivered annualized returns of 42.2% vs BSE SENSEX, BSE Midcap and BSE Smallcap returns of 12.0%, 13.4% and 21.0% respectively, delivering outperformance of between 2,100 bps to 3,000 bps over various indices on an annualized basis.
Performance Snapshot
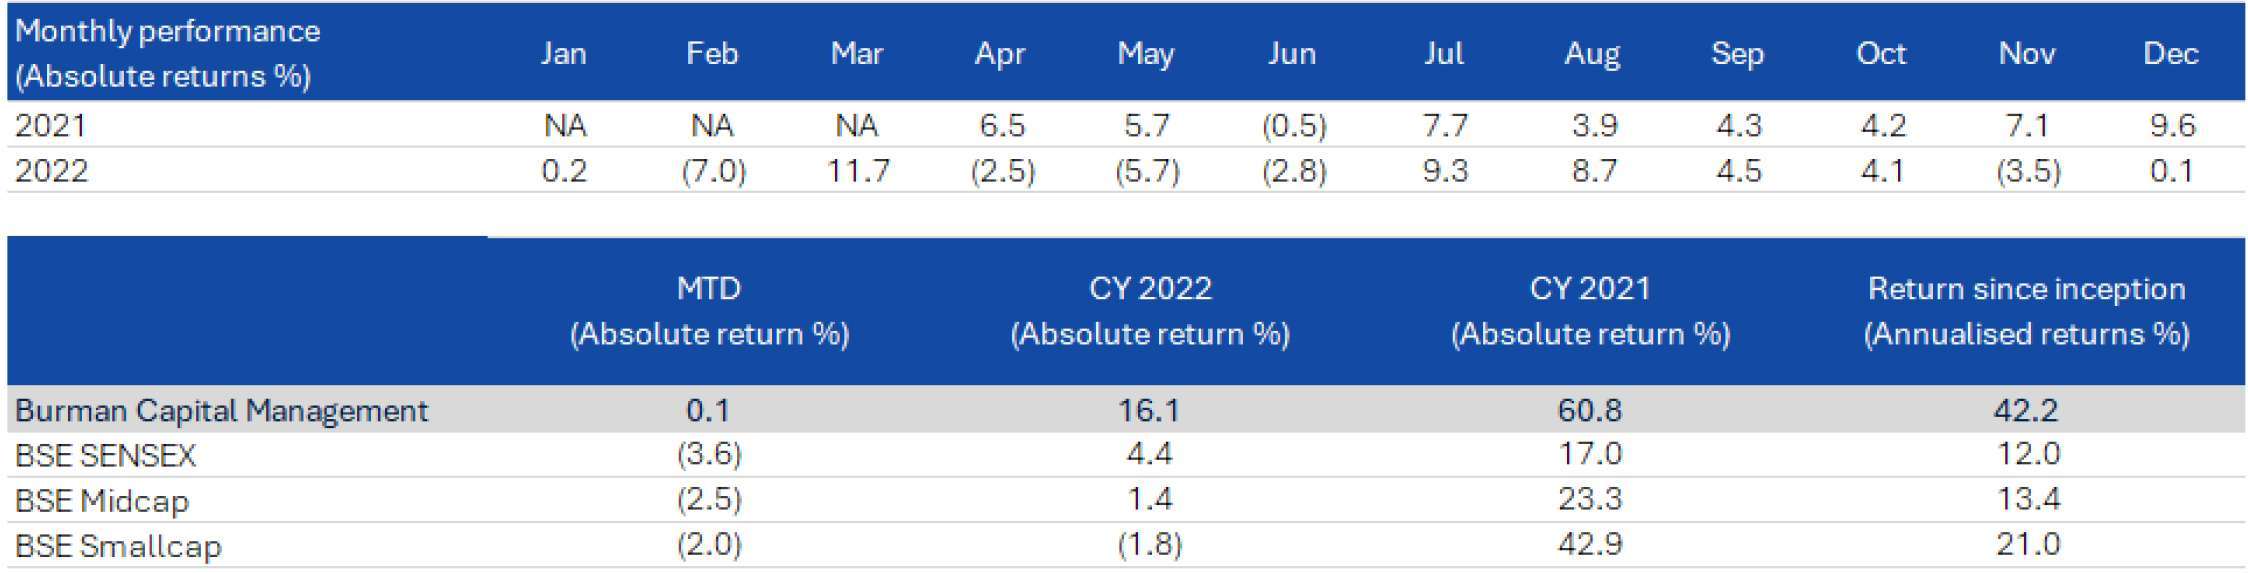
Note: CY2021 portfolio and benchmark returns are since inception; portfolio inception date is Mar 23, 2021
What is Specificity
“The quality of belonging or relating uniquely to a particular subject”
Various studies seem to suggest that humans make between 10,000 to 35,000 decisions per day. Due to the sheer quantum of decisions, human brains have evolved in a manner to simplify, categorize, and generalize in-coming stimuli especially in complex systems.
Financial markets are a prime example of a complex system with endless flow of information. Hence, it is not surprising that the human urge to simplify, categorize and generalize information is rampant in financial markets. Think ‘Value vs Growth’, ‘Small-caps vs Large-caps’, etc.
In our view, ‘non-specific’ i.e. ‘generalist’ thinking leads to mistakes of both omission and commission. It’s surprising to us that a significant part of the investment community (think passive funds, for example) do not clearly make that distinction. Below, we discuss various examples to highlight how ‘generic’ thinking would have been disadvantageous in CY2022.
US sneezed in CY2022; India avoided catching a cold
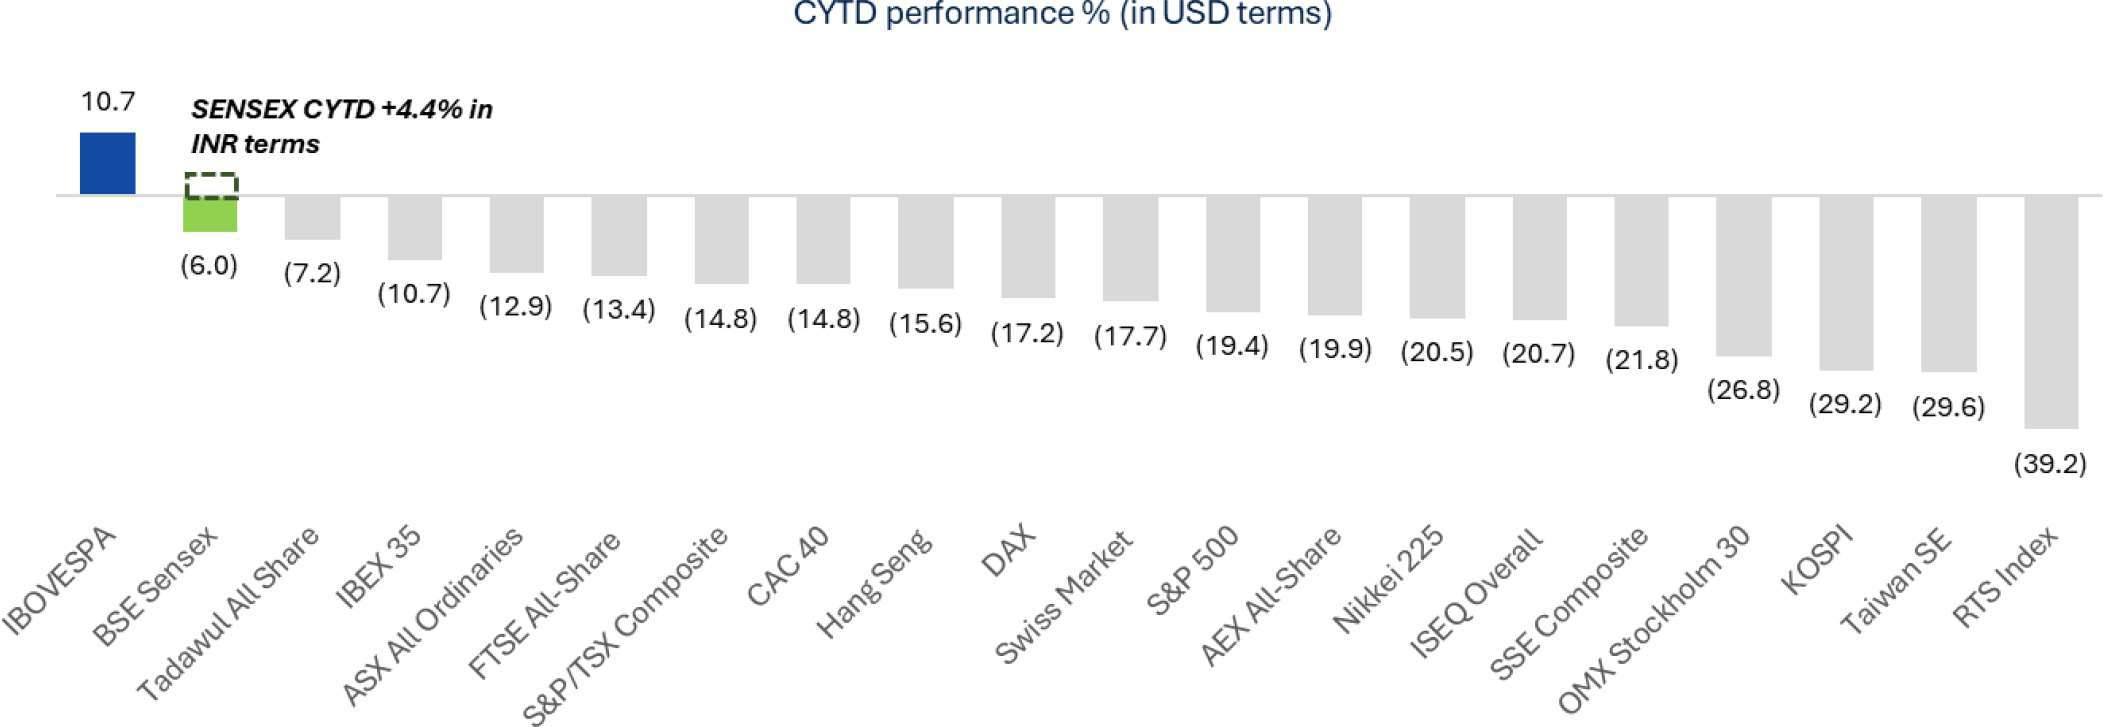
‘When US sneezes, the world catches a cold’ is a popular adage. CY2022 proved how the ‘generic’ adage fell flat in the face of specific country-level nuances.
India outperformed developed markets by a wide margin in CY2022 as shown in the chart below which compares key index returns for the top-20 countries by market capitalization. The BSE SENSEX delivered 4.4% in local currency terms/ (-)6.0% in USD – substantial outperformance vs. S&P500 which was down (-)19.4% in CY2022. A result no one would have expected given high crude prices, sharp INR depreciation, large US$35 bn exodus of FPIs, among others in CY2022.
India’s outperformance was driven by several specific factors unique to current times
• Resilience of the domestic economy with strong GDP growth
• Strong domestic fund flows that matched foreign fund flow exits almost one-to-one
• War-chest of forex reserves built over the last decade
• Relatively (vs developed markets) stable inflation trends
• Specific government initiatives such as PLI scheme
• Among others
While at an index-level, India avoided catching a cold, the IT and tech sectors still caught it
There was a 5,000bps divergence of returns between the best performing and worst performing sector indices. Clearly, a ‘generic’ bet on India wasn’t enough to generate returns in CY2022.
BSE Power was the best performing (+25.8%) index in India in CY2022 while BSE IT was the worst performing (-24.2%). Interestingly, BSE IT underperformed S&P500 by a wide margin. Twelve out of Nineteen indices in the chart below ended positive while seven ended negative.

The BSE Bank index performed exceptionally well with 21% returns driven largely by PSU (Public Sector Undertaking) banks. PSU banks had been struggling over the last decade driven by both growth and asset quality problems. Over the last five years asset quality issues have largely been cleaned-up and most recently, credit growth is showing signs of picking up – the outperformance largely re-rating led reflects the fact that valuations had reached highly pessimistic levels. BSE IT was completely the opposite. Driven by a surge in revenue because of COVID-19 led digital investment acceleration by global corporates, the index was trading at multi-year high growth numbers and multiples; this corrected in 2022. Both cases are reflective of specific circumstances.
While the IT index was down 24.2%, our only investment overlapping with the IT index was up 15%. Also, several stocks part of BSE Power and BSE Bank delivered negative returns
Within each sector, wide divergence was visible – top decile stocks in the worst performing sectors outperformed the bottom quartile stocks in the best performing sectors despite the wide sector-level divergence. In IT, which was the worst performing sector, returns varied from -82.7% to +313.4%. The datapoints below show that money could have been lost betting on the best-performing sector, while money could be made investing in the worst-performing sector.

While the discussion above is focused on one-year performance, any larger timeframe will give very similar answers i.e. performance of a stock is dependent on the evolution of its underlying business’ specific circumstances. While country-level and sector-level dynamics are important the same cannot be blindly extrapolated to company-specific dynamics.
In fact, even for individual stocks/businesses there may be specific circumstances which lead to wide dispersion in performance over different time periods. The Stock A and Stock B illustration at the beginning of the newsletter is an interesting case study of how Stock A/Stock B look like two different companies rather than the same company in two different situations – which is the case. Investment returns obviously vary substantially depending on when one chooses to invest.
Stock A and Stock B is the same company at different points of time
The company in question is amongst the largest manufacturer and distributor of MDF (Medium Density Fiberboard) in India. The MDF industry had its birth in the late 2000’s but for almost a decade none of the major players invested in building capacity or distribution. However, towards the latter half of the 2010’s consumer preference started changing and MDF adoption grew at a rapid pace. Foreign players especially from South-East Asia started seeing India as an opportunity as their core market growth started tapering and ramped-up exports to India. Indian manufacturers, late to the party started playing catch-up and built capacity aggressively.
Increasing exports and increasing domestic supply overshot demand leading to a supply glut. This in turn impacted price negatively and eroded margins for domestic players from 30%+ to less than 15%. The industry’s fortunes got further hit with COVID-19. The company in question was worst hit because of high leverage it had taken to fund capacity expansion. By Sep-2020, the stock collapsed with the company’s financials in a mess i.e. Stock A in the illustration.
Interestingly, the industry’s fortune started changing rapidly thereon. Driven by the work-from-home culture, there was a demand boom for home furniture. Moreover, ocean freight jumped substantially making exports to India unviable for foreign players. In less than eighteen months, the industry moved from a situation of over-supply to surplus demand and most MDF manufacturers started operating at more than 100% capacity utilization. Moreover, given surplus demand the industry took aggressive price hikes to the tune of 30%+ leading them to start reporting margins of 30%+ and ROIC of 30%+ i.e. Stock B in the illustration.
However, the situation again started changing. Local players started importing lower quality machinery from China at a fraction of capex requirement and started dumping cheap MDF in the market – gaining more than 25% market share in a short duration. Together with above, the work-from-home driven demand uptick started waning off and organized players started reporting volume de-growth and consequent margin erosion driving a 25% stock price correction.
The reason for elaborating the entire industry context above is to showcase that understanding specific business context and thinking grounds-up is of paramount importance. In the above case, fixating on reported numbers rather than qualitative ground-realities would have led to mistakes.